Chart Trading
The Amabit trading terminal lets you interact with your positions and orders directly on the price chart. Open positions, Take-Profit, and Stop-Loss orders are displayed as horizontal lines on the chart, and you can manage them without leaving the chart view.
Order and Position Lines on the Chart
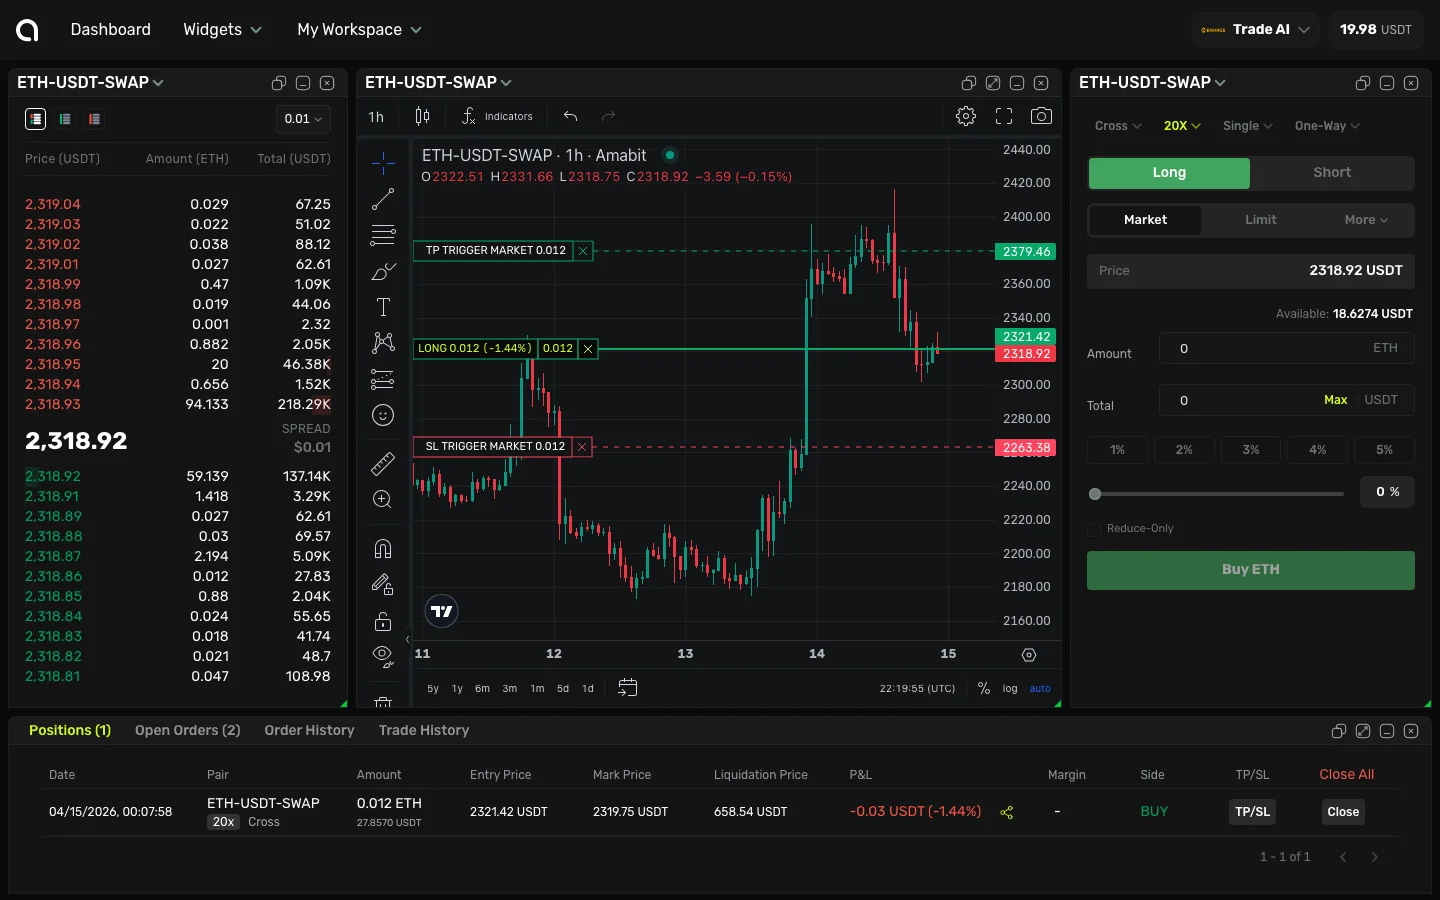
When you have an open position with TP/SL orders, the chart displays:
- Position entry line (green for LONG, red for SHORT) — Shows your entry price, position size, current P&L percentage, and unrealized profit/loss. For example:
LONG 0.012 (-1.44%) -0.012 - Take-Profit line (green, above entry for LONG) — Shows
TP TRIGGER MARKETwith the order size. This is where your take-profit will trigger - Stop-Loss line (red, below entry for LONG) — Shows
SL TRIGGER MARKETwith the order size. This is where your stop-loss will trigger
The lines move in real-time as the price changes, and the P&L on the position line updates live.
Interacting with Chart Lines
You can manage your positions and orders by clicking directly on their lines on the chart:
- Click on the position line — Opens the Close Position dialog, where you can choose how much of the position to close (25%, 50%, 75%, or 100%) and confirm
- Click on a TP or SL order line — Opens the Cancel Order dialog, where you can review the order details and cancel it
This lets you manage everything directly from the chart without scrolling to the Positions or Orders tabs at the bottom.
Price Selection with the Plus Button
When hovering over the price scale (the right edge of the chart), a + button appears at your cursor position. Click it to:
- Select the price at your cursor position
- The selected price is automatically filled into the Price field in the order form on the right
- You can then adjust the amount and place the order
This is useful for quickly setting limit order prices at specific chart levels — support, resistance, or round numbers — without manually typing the price.
Tips for Chart Trading
- Use TP/SL lines visually — Seeing your stops and targets on the chart helps you understand risk/reward at a glance
- Click + on key levels — Set limit orders at support/resistance levels by clicking the + on the price scale
- Monitor P&L in real-time — The position line shows your unrealized P&L as the price moves
- Manage from the chart — Close positions or cancel orders without scrolling to the Positions/Orders tabs