Performance Analytics
Amabit provides detailed performance analytics for each trading account, helping you track your progress and identify areas for improvement.
Accessing Statistics
Click Statistics in the sidebar of your account page. Statistics are available for all account types.
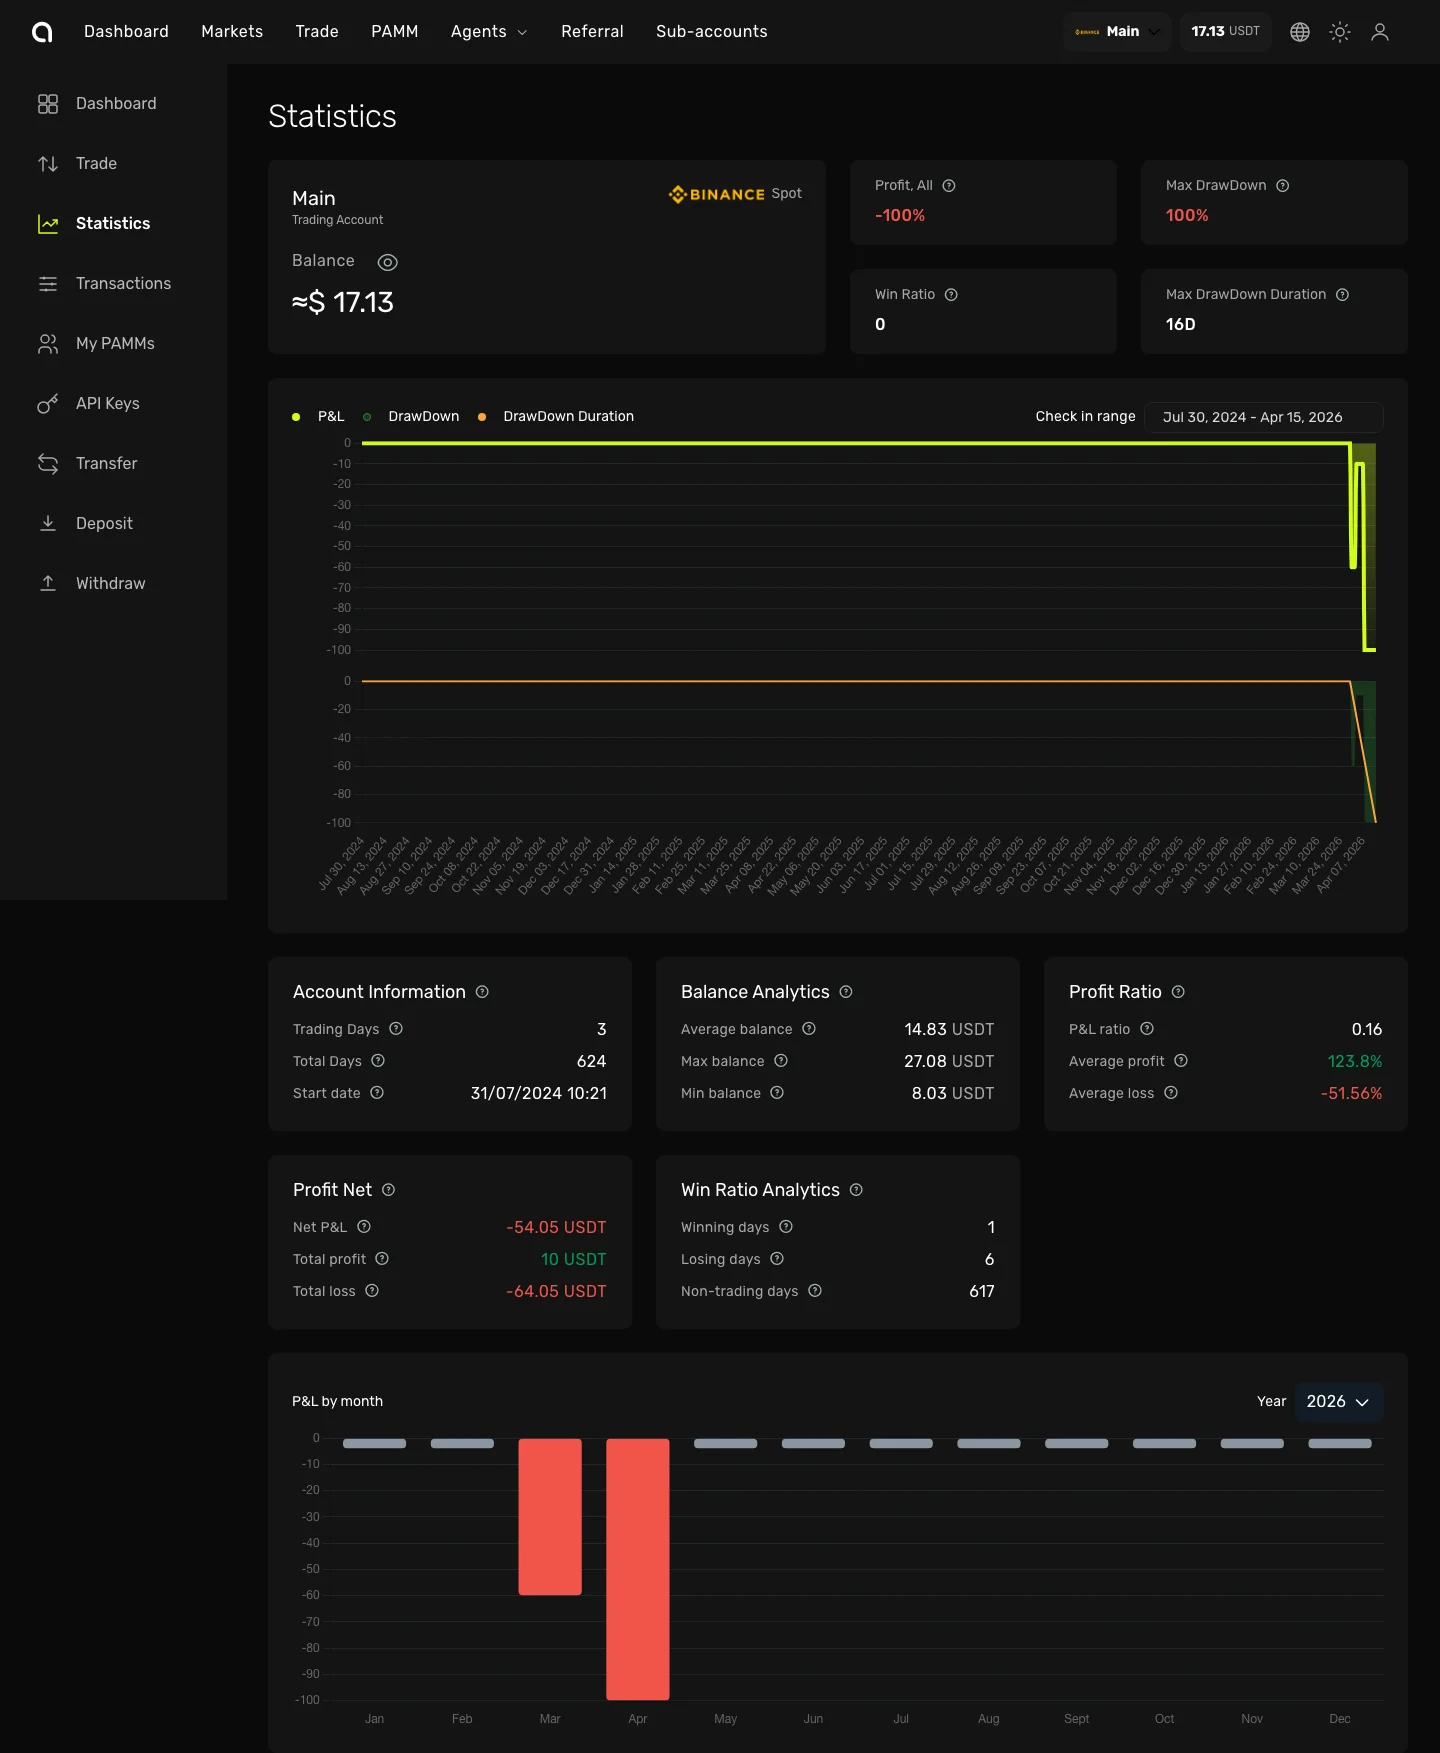
Overview Cards
At the top of the page you'll see summary cards:
| Card | Description |
|---|---|
| Profit, All | Total profit or loss since the account's start date |
| Max Drawdown | The largest peak-to-trough decline in your account value (in %) |
| Win Ratio | Number of profitable trades vs total trades |
| Max Drawdown Duration | How many days the longest drawdown lasted |
PnL Chart
The main chart shows your performance over time with three switchable views:
- PnL — Cumulative profit and loss curve
- Drawdown — Drawdown percentage over time
- Drawdown Duration — Duration of each drawdown period
Use the Check in range date picker to select a custom period.
Analytics Cards
Below the chart, detailed analytics are organized into cards:
Account Information
| Metric | Description |
|---|---|
| Trading Days | Number of days with at least one trade |
| Total Days | Days since the account's start date |
| Start Date | When the statistics tracking began |
Balance Analytics
| Metric | Description |
|---|---|
| Average Balance | Average account balance over the period |
| Max Balance | Highest balance reached |
| Min Balance | Lowest balance reached |
Profit Ratio
| Metric | Description |
|---|---|
| PnL Ratio | Overall return percentage |
| Average Profit | Average profit per winning trade |
| Average Loss | Average loss per losing trade |
Profit Net
| Metric | Description |
|---|---|
| Net PnL | Net profit/loss amount |
| Total Profit | Sum of all profitable trades |
| Total Loss | Sum of all losing trades |
Win Ratio Analytics
| Metric | Description |
|---|---|
| Winning Days | Number of profitable trading days |
| Losing Days | Number of unprofitable trading days |
| Non-trading Days | Days without any trades |
PnL by Month
The bar chart at the bottom shows monthly profit/loss breakdown. Use the year selector to navigate between years. Green bars indicate profitable months, red bars — losing months.